Spectrogram
- class ketos.audio.spectrogram.Spectrogram(data, time_res, type, freq_ax, filename=None, offset=0, label=None, annot=None, transforms=None, transform_log=None, waveform_transform_log=None, **kwargs)[source]
Spectrogram.
Parent class for MagSpectrogram, PowerSpectrogram, MelSpectrogram, and CQTSpectrogram.
The Spectrogram class stores the spectrogram pixel values in a numpy array, where the first axis (0) is the time dimension and the second axis (1) is the frequency dimensions.
- Args:
- data: numpy array
Spectrogram matrix.
- time_res: float
Time resolution in seconds (corresponds to the bin size used on the time axis)
- type: str
- Spectrogram type. Options include,
‘Mag’: Magnitude spectrogram
‘Pow’: Power spectrogram
‘Mel’: Mel spectrogram
‘CQT’: CQT spectrogram
- freq_ax: LinearAxis or Log2Axis
Axis object for the frequency dimension
- filename: str or list(str)
Name of the source audio file, if available.
- offset: float or array-like
Position in seconds of the left edge of the spectrogram within the source audio file, if available.
- label: int
Spectrogram label. Optional
- annot: AnnotationHandler
AnnotationHandler object. Optional
- transforms: list(dict)
List of dictionaries, where each dictionary specifies the name of a transformation to be applied to the spectrogram. For example, {“name”:”normalize”, “mean”:0.5, “std”:1.0}
- transform_log: list(dict)
List of transforms that have been applied to this spectrogram
- waveform_transform_log: list(dict)
List of transforms that have been applied to the waveform before generating this spectrogram
- Attributes:
- data: numpy array
Spectrogram matrix.
- time_ax: LinearAxis
Axis object for the time dimension
- freq_ax: LinearAxis or Log2Axis
Axis object for the frequency dimension
- type: str
- Spectrogram type. Options include,
‘Mag’: Magnitude spectrogram
‘Pow’: Power spectrogram
‘Mel’: Mel spectrogram
‘CQT’: CQT spectrogram
- filename: str or list(str)
Name of the source audio file.
- offset: float or array-like
Position in seconds of the left edge of the spectrogram within the source audio file.
- label: int
Spectrogram label.
- annot: AnnotationHandler
AnnotationHandler object.
- transform_log: list(dict)
List of transforms that have been applied to this spectrogram
- waveform_transform_log: list(dict)
List of transforms that have been applied to the waveform before generating this spectrogram
Methods
add(spec[, offset, scale, make_copy])Add another spectrogram on top of this spectrogram.
blur(sigma_time[, sigma_freq])Blur the spectrogram using a Gaussian filter.
crop([start, end, length, freq_min, ...])Crop spectogram along time axis, frequency axis, or both.
enhance_signal([enhancement])Enhance the contrast between regions of high and low intensity.
freq_max()Get spectrogram maximum frequency in Hz.
freq_min()Get spectrogram minimum frequency in Hz.
Get keyword arguments required to create a copy of this instance.
Get audio representation attributes
infer_shape(**kwargs)Infers the spectrogram shape that would result if the class were instantiated with a specific set of parameter values.
plot([show_annot, figsize, cmap, ...])Plot the spectrogram with proper axes ranges and labels.
reduce_tonal_noise([method])Reduce continuous tonal noise produced by e.g. ships and slowly varying background noise.
resize([shape, time_res])Resize the spectrogram.
- add(spec, offset=0, scale=1, make_copy=False)[source]
Add another spectrogram on top of this spectrogram.
The spectrograms must be of the same type, and share the same time resolution.
The spectrograms must have consistent frequency axes. For linear frequency axes, this implies having the same resolution; for logarithmic axes with base 2, this implies having the same number of bins per octave minimum values that differ by a factor of 2^{n/m} where m is the number of bins per octave and n is any integer. No check is made for the consistency of the frequency axes.
Note that the attributes filename, offset, and label of the spectrogram that is being added are lost.
The sum spectrogram has the same dimensions (time x frequency) as the original spectrogram.
- Args:
- spec: Spectrogram
Spectrogram to be added
- offset: float
Shift the spectrograms that is being added by this many seconds relative to the original spectrogram.
- scale: float
Scaling factor applied to spectrogram that is added
- make_copy: bool
Make copies of both spectrograms so as to leave the original instances unchanged.
- Returns:
- : Spectrogram
Sum spectrogram
- blur(sigma_time, sigma_freq=0)[source]
Blur the spectrogram using a Gaussian filter.
Note that the spectrogram frequency axis must be linear if sigma_freq > 0.
This uses the Gaussian filter method from the scipy.ndimage package:
- Args:
- sigma_time: float
Gaussian kernel standard deviation along time axis in seconds. Must be strictly positive.
- sigma_freq: float
Gaussian kernel standard deviation along frequency axis in Hz.
- Example:
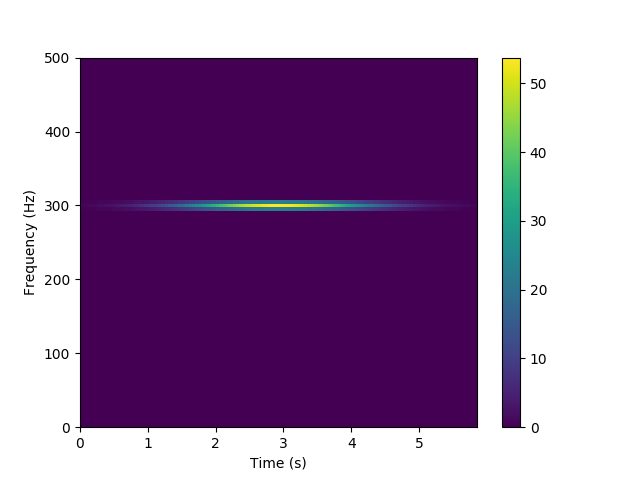
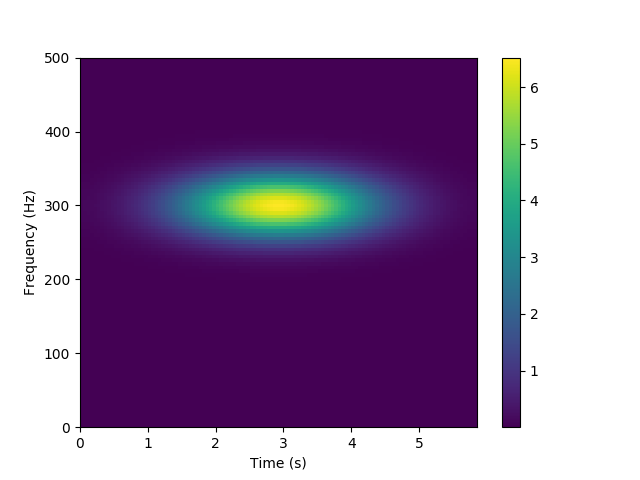
>>> from ketos.audio.spectrogram import Spectrogram
>>> from ketos.audio.waveform import Waveform
>>> import matplotlib.pyplot as plt
>>> # create audio signal
>>> s = Waveform.morlet(rate=1000, frequency=300, width=1)
>>> # create spectrogram
>>> spec = MagSpectrogram.from_waveform(s, window=0.2, step=0.05)
>>> # show image
>>> fig = spec.plot()
>>> plt.close(fig)
>>> # apply very small amount (0.01 sec) of horizontal blur
>>> # and significant amount of vertical blur (30 Hz)
>>> spec.blur(sigma_time=0.01, sigma_freq=30)
>>> # show blurred image
>>> fig = spec.plot()
>>> plt.close(fig)
- crop(start=None, end=None, length=None, freq_min=None, freq_max=None, height=None, make_copy=False)[source]
Crop spectogram along time axis, frequency axis, or both.
- Args:
- start: float
Start time in seconds, measured from the left edge of spectrogram.
- end: float
End time in seconds, measured from the left edge of spectrogram.
- length: int
Horizontal size of the cropped image (number of pixels). If provided, the end argument is ignored.
- freq_min: float
Lower frequency in Hz.
- freq_max: str or float
Upper frequency in Hz.
- height: int
Vertical size of the cropped image (number of pixels). If provided, the freq_max argument is ignored.
- make_copy: bool
Return a cropped copy of the spectrogra. Leaves the present instance unaffected. Default is False.
- Returns:
- spec: Spectrogram
Cropped spectrogram
- Examples:
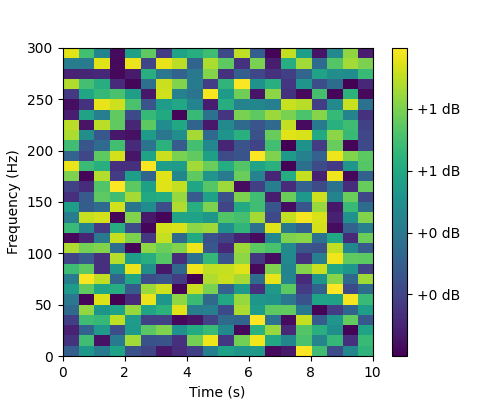
>>> import numpy as np
>>> import matplotlib.pyplot as plt
>>> from ketos.audio.spectrogram import Spectrogram
>>> from ketos.audio.utils.axis import LinearAxis
>>> # Create a spectrogram with shape (20,30), time resolution of
>>> # 0.5 s, random pixel values, and a linear frequency axis from
>>> # 0 to 300 Hz,
>>> ax = LinearAxis(bins=30, extent=(0.,300.), label='Frequency (Hz)')
>>> img = np.random.rand(20,30)
>>> spec = Spectrogram(data=img, time_res=0.5, type='Mag', freq_ax=ax)
>>> # Draw the spectrogram
>>> fig = spec.plot()
>>> fig.savefig("ketos/tests/assets/tmp/spec_orig.png")
>>> plt.close(fig)

>>> # Crop the spectrogram along time axis
>>> spec1 = spec.crop(start=2.0, end=4.2, make_copy=True)
>>> # Draw the spectrogram
>>> fig = spec.plot()
>>> fig.savefig("ketos/tests/assets/tmp/spec_cropped.png")
>>> plt.close(fig)
- enhance_signal(enhancement=1.0)[source]
Enhance the contrast between regions of high and low intensity.
See
audio.image.enhance_image()for implementation details.- Args:
- enhancement: float
Parameter determining the amount of enhancement.
- get_kwargs()[source]
Get keyword arguments required to create a copy of this instance.
Does not include the data array and annotation handler.
- classmethod infer_shape(**kwargs)[source]
Infers the spectrogram shape that would result if the class were instantiated with a specific set of parameter values. Returns a None value if the shape could not be inferred. Accepts the same list of arguments as the from_wav method, which is implemented in the child classes.
Note: The current implementation involves computing a dummy spectrogram. Therefore, if this method is called repeatedly the computational overhead can become substantial.
- Returns:
- : tuple
Inferred shape. If the parameter value do not allow the shape be inferred, a None value is returned.
- plot(show_annot=False, figsize=(5, 4), cmap='viridis', label_in_title=True, vmin=None, vmax=None, annot_kwargs=None)[source]
Plot the spectrogram with proper axes ranges and labels.
Optionally, also display annotations as boxes superimposed on the spectrogram.
The colormaps available can be seen here: https://matplotlib.org/3.1.0/tutorials/colors/colormaps.html
Note: The resulting figure can be shown (fig.show()) or saved (fig.savefig(file_name))
- Args:
- show_annot: bool
Display annotations
- figsize: tuple
Figure size
- cmap: string
The colormap to be used
- label_in_title: bool
Include label (if available) in figure title
- vmin, vmaxscalar, optional
When using scalar data and no explicit norm, vmin and vmax define the data range that the colormap covers. By default, the colormap covers the complete value range of the supplied data. vmin, vmax are ignored if the norm parameter is used.
- annot_kwargs: dict
Annotation box extra parameters following matplotlib values. Only relevant if show_annot is True. The following matplotlib options are currently supported:
Property
description
color
color for the annotation box and text. See matplotlib for color options
linewidth
width for the annotaiton box. float or None
fontsize
float or {‘xx-small’, ‘x-small’, ‘small’, ‘medium’, ‘large’, ‘x-large’, ‘xx-large’}
fontweight
{a numeric value in range 0-1000, ‘ultralight’, ‘light’, ‘normal’, ‘regular’, ‘book’, ‘medium’, ‘roman’, ‘semibold’, ‘demibold’, ‘demi’, ‘bold’, ‘heavy’, ‘extra bold’, ‘black’}
A dictionary may be used to specify different options for different label values. For example, {1: {“color”: “C0”, “fontweight”: “bold”},3: {“color”: “C2”,}} would assign the color “C0” and fontweight bold to label value 1 and “C2” to label value 3. The default color is “C1”.
- Returns:
fig: matplotlib.figure.Figure A figure object.
- Example:
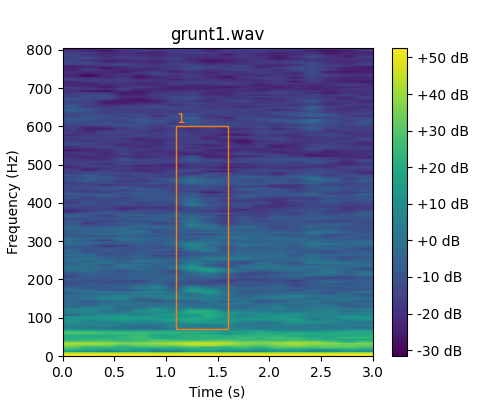
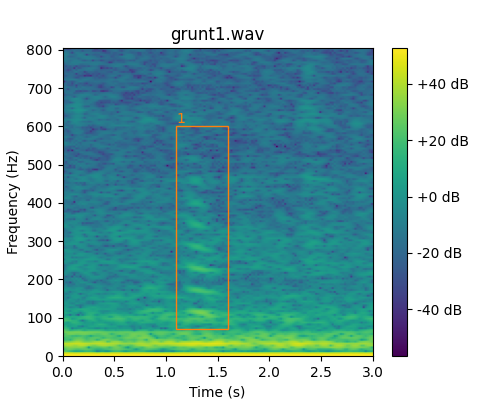
>>> from ketos.audio.spectrogram import MagSpectrogram
>>> # load spectrogram
>>> spec = MagSpectrogram.from_wav('ketos/tests/assets/grunt1.wav', window=0.2, step=0.02)
>>> # add an annotation
>>> spec.annotate(start=1.1, end=1.6, freq_min=70, freq_max=600, label=1)
>>> # keep only frequencies below 800 Hz
>>> spec = spec.crop(freq_max=800)
>>> # show spectrogram with annotation box
>>> fig = spec.plot(show_annot=True)
>>> fig.savefig("ketos/tests/assets/tmp/spec_w_annot_box.png")
>>> plt.close(fig)
- reduce_tonal_noise(method='MEDIAN', **kwargs)[source]
Reduce continuous tonal noise produced by e.g. ships and slowly varying background noise
See
audio.image.reduce_tonal_noise()for implementation details.Currently, offers the following two methods:
MEDIAN: Subtracts from each row the median value of that row.
RUNNING_MEAN: Subtracts from each row the running mean of that row.
The running mean is computed according to the formula given in Baumgartner & Mussoline, JASA 129, 2889 (2011); doi: 10.1121/1.3562166
- Args:
- method: str
Options are ‘MEDIAN’ and ‘RUNNING_MEAN’
- Optional args:
- time_constant: float
Time constant in seconds, used for the computation of the running mean. Must be provided if the method ‘RUNNING_MEAN’ is chosen.
- Example:
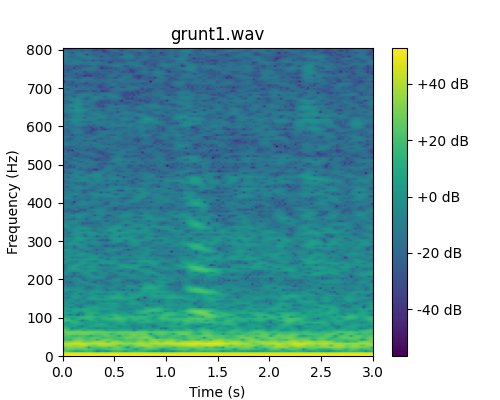
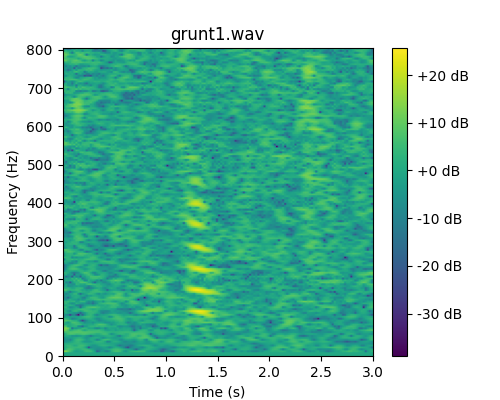
>>> # read audio file
>>> from ketos.audio.waveform import Waveform
>>> aud = Waveform.from_wav('ketos/tests/assets/grunt1.wav')
>>> # compute the spectrogram
>>> from ketos.audio.spectrogram import MagSpectrogram
>>> spec = MagSpectrogram.from_waveform(aud, window=0.2, step=0.02)
>>> # keep only frequencies below 800 Hz
>>> spec = spec.crop(freq_max=800)
>>> # show spectrogram as is
>>> fig = spec.plot()
>>> fig.savefig("ketos/tests/assets/tmp/spec_before_tonal.png")
>>> plt.close(fig)
>>> # tonal noise reduction
>>> spec.reduce_tonal_noise()
>>> # show modified spectrogram
>>> fig = spec.plot()
>>> fig.savefig("ketos/tests/assets/tmp/spec_after_tonal.png")
>>> plt.close(fig)
- resize(shape=None, time_res=None, **kwargs)[source]
Resize the spectrogram.
The resizing operation can be controlled either by specifying the shape of the resized spectrogram or by specifying the desired time resolution. In the latter case, the spectrogram is only resized along the time axis.
The resizing operation is performed using the resize method of the scikit-image package, which interpolates the pixel values:
Use keyword arguments to control the behavior of scikit-image’s resize operation.
- Args:
- shape: tuple(int,int)
Shape of the resized spectrogram
- time_res: float
Time resolution of the resized spectrogram in seconds. Note that the actual time resolution of the resized spectrogram may differ slightly from that specified via the time_res argument, as required to produce an image with an integer number of time bins.
- Returns:
None
- Example:
>>> from ketos.audio.spectrogram import MagSpectrogram
>>> # load spectrogram
>>> spec = MagSpectrogram.from_wav('ketos/tests/assets/grunt1.wav', window=0.2, step=0.02)
>>> # add an annotation
>>> spec.annotate(start=1.1, end=1.6, freq_min=70, freq_max=600, label=1)
>>> # keep only frequencies below 800 Hz
>>> spec = spec.crop(freq_max=800)
>>> # make a copy of the current spectrogram, then reduce time resolution by a factor of eight
>>> spec_orig = spec.deepcopy()
>>> new_time_res = 8.0 * spec.time_res()
>>> spec.resize(time_res=new_time_res)
>>> # show spectrograms
>>> fig = spec_orig.plot(show_annot=True)
>>> fig.savefig("ketos/tests/assets/tmp/spec_w_annot_box.png")
>>> plt.close(fig)
>>> fig = spec.plot(show_annot=True)
>>> fig.savefig("ketos/tests/assets/tmp/spec_w_annot_box_reduced_resolution.png")
>>> plt.close(fig)