CQTSpectrogram
- class ketos.audio.spectrogram.CQTSpectrogram(data, time_res, bins_per_oct, freq_min, window_func=None, filename=None, offset=0, label=None, annot=None, transforms=None, transform_log=None, waveform_transform_log=None, **kwargs)[source]
Magnitude Spectrogram computed from Constant Q Transform (CQT).
- Args:
- image: 2d or 3d numpy array
Spectrogram pixel values.
- time_res: float
Time resolution in seconds (corresponds to the bin size used on the time axis)
- freq_min: float
Lower value of the frequency axis in Hz
- bins_per_oct: int
Number of bins per octave
- window_func: str
Window function used for computing the spectrogram
- filename: str or list(str)
Name of the source audio file, if available.
- offset: float or array-like
Position in seconds of the left edge of the spectrogram within the source audio file, if available.
- label: int
Spectrogram label. Optional
- annot: AnnotationHandler
AnnotationHandler object. Optional
- transforms: list(dict)
List of dictionaries, where each dictionary specifies the name of a transformation to be applied to the spectrogram. For example, {“name”:”normalize”, “mean”:0.5, “std”:1.0}
- transform_log: list(dict)
List of transforms that have been applied to this spectrogram
- waveform_transform_log: list(dict)
List of transforms that have been applied to the waveform before generating this spectrogram
- Attrs:
- window_func: str
Window function.
Methods
Get no.
empty()Creates an empty CQTSpectrogram object
from_wav(path, step, bins_per_oct[, ...])Create CQT spectrogram directly from wav file.
from_waveform(audio, step, bins_per_oct[, ...])Magnitude Spectrogram computed from Constant Q Transform (CQT) using the librosa implementation:
Get keyword arguments required to create a copy of this instance.
Get audio representation attributes
plot([show_annot, figsize, cmap, ...])Plot the spectrogram with proper axes ranges and labels.
- classmethod from_wav(path, step, bins_per_oct, freq_min=1, freq_max=None, channel=0, rate=None, window_func='hann', offset=0, duration=None, resample_method='scipy', id=None, normalize_wav=False, transforms=None, waveform_transforms=None, smooth=0.01, **kwargs)[source]
Create CQT spectrogram directly from wav file.
The arguments offset and duration can be used to select a segment of the audio file.
Note that values specified for the arguments window, step, offset, and duration may all be subject to slight adjustments to ensure that the selected portion corresponds to an integer number of window frames, and that the window and step sizes correspond to an integer number of samples.
- Args:
- path: str
Complete path to wav file
- step: float
Step size in seconds
- bins_per_oct: int
Number of bins per octave
- freq_min: float
Minimum frequency in Hz. Default is 1 Hz.
- freq_max: float
Maximum frequency in Hz If None, it is set half the sampling rate.
- channel: int
Channel to read from. Only relevant for stereo recordings
- rate: float
Desired sampling rate in Hz. If None, the original sampling rate will be used
- window_func: str
- Window function (optional). Select between
bartlett
blackman
hamming (default)
hanning
- offset: float
Start time of spectrogram in seconds, relative the start of the wav file.
- duration: float
Length of spectrogrma in seconds.
- resample_method: str
- Resampling method. Only relevant if rate is specified. Options are
kaiser_best
kaiser_fast
scipy (default)
polyphase
See https://librosa.github.io/librosa/generated/librosa.core.resample.html for details on the individual methods.
- id: str
Unique identifier (optional). If None, the filename will be used.
- normalize_wav: bool
Normalize the waveform to have a mean of zero (mean=0) and a standard deviation of unity (std=1) before computing the spectrogram. Default is False.
- transforms: list(dict)
List of dictionaries, where each dictionary specifies the name of a transformation to be applied to the spectrogram. For example, {“name”:”normalize”, “mean”:0.5, “std”:1.0}
- waveform_transforms: list(dict)
List of dictionaries, where each dictionary specifies the name of a transformation to be applied to the waveform before generating the spectrogram. For example, {“name”:”add_gaussian_noise”, “sigma”:0.5}
- smooth: float
Width in seconds of the smoothing region used for stitching together audio files.
- Returns:
- : CQTSpectrogram
CQT spectrogram
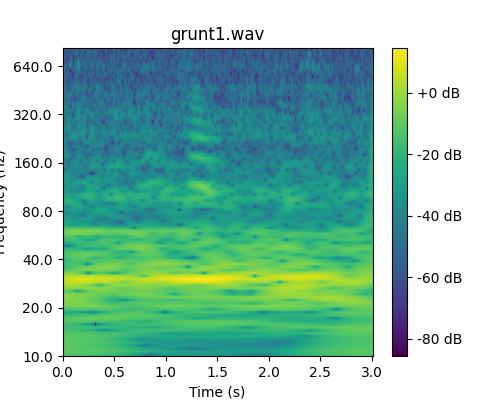
- Example:
>>> # load spectrogram from wav file
>>> from ketos.audio.spectrogram import CQTSpectrogram
>>> spec = CQTSpectrogram.from_wav('ketos/tests/assets/grunt1.wav', step=0.01, freq_min=10, freq_max=800, bins_per_oct=16)
>>> # show
>>> fig = spec.plot()
>>> fig.savefig("ketos/tests/assets/tmp/cqt_grunt1.png")
>>> plt.close(fig)
- classmethod from_waveform(audio, step, bins_per_oct, freq_min=1, freq_max=None, window_func='hann', transforms=None, **kwargs)[source]
Magnitude Spectrogram computed from Constant Q Transform (CQT) using the librosa implementation:
https://librosa.github.io/librosa/generated/librosa.core.cqt.html
The frequency axis of a CQT spectrogram is essentially a logarithmic axis with base 2. It is characterized by an integer number of bins per octave (an octave being a doubling of the frequency.)
For further details, see
audio.audio.cqt().- Args:
- audio: Waveform
Audio signal
- step: float
Step size in seconds
- bins_per_oct: int
Number of bins per octave
- freq_min: float
Minimum frequency in Hz. Default is 1 Hz.
- freq_max: float
Maximum frequency in Hz If None, it is set half the sampling rate.
- window_func: str
- Window function (optional). Select between
bartlett
blackman
hamming
hanning (default)
- transforms: list(dict)
List of dictionaries, where each dictionary specifies the name of a transformation to be applied to the spectrogram. For example, {“name”:”normalize”, “mean”:0.5, “std”:1.0}
- Returns:
- spec: CQTSpectrogram
CQT spectrogram
- get_kwargs()[source]
Get keyword arguments required to create a copy of this instance.
Does not include the data array and annotation handler.
- plot(show_annot=False, figsize=(5, 4), cmap='viridis', label_in_title=True, vmin=None, vmax=None)[source]
Plot the spectrogram with proper axes ranges and labels.
Optionally, also display annotations as boxes superimposed on the spectrogram.
The colormaps available can be seen here: https://matplotlib.org/3.1.0/tutorials/colors/colormaps.html
Note: The resulting figure can be shown (fig.show()) or saved (fig.savefig(file_name))
- Args:
- show_annot: bool
Display annotations
- figsize: tuple
Figure size
- cmap: string
The colormap to be used
- label_in_title: bool
Include label (if available) in figure title
- Returns:
- fig: matplotlib.figure.Figure
A figure object.