MagSpectrogram
- class ketos.audio.spectrogram.MagSpectrogram(data, time_res, freq_min, freq_res, window_func=None, filename=None, offset=0, label=None, annot=None, transforms=None, transform_log=None, waveform_transform_log=None, phase_angle=None, **kwargs)[source]
Magnitude Spectrogram.
While the underlying data array can be accessed via the
dataattribute, it is recommended to always use theget_data()function to access the data array, i.e.,>>> from ketos.audio.base_audio import BaseAudio >>> x = np.ones(6) >>> audio_sample = BaseAudio(data=x) >>> audio_sample.get_data() array([1., 1., 1., 1., 1., 1.])
- Args:
- data: numpy array
Magnitude spectrogram.
- time_res: float
Time resolution in seconds (corresponds to the bin size used on the time axis)
- freq_min: float
Lower value of the frequency axis in Hz
- freq_res: float
Frequency resolution in Hz (corresponds to the bin size used on the frequency axis)
- window_func: str
Window function used for computing the spectrogram
- filename: str or list(str)
Name of the source audio file, if available.
- offset: float or array-like
Position in seconds of the left edge of the spectrogram within the source audio file, if available.
- label: int
Spectrogram label. Optional
- annot: AnnotationHandler
AnnotationHandler object. Optional
- transforms: list(dict)
List of dictionaries, where each dictionary specifies the name of a transformation to be applied to the spectrogram. For example, {“name”:”normalize”, “mean”:0.5, “std”:1.0}
- transform_log: list(dict)
List of transforms that have been applied to this spectrogram
- waveform_transform_log: list(dict)
List of transforms that have been applied to the waveform before generating this spectrogram
- phase_angle: numpy.array
Complex phase angle.
- Attrs:
- data: numpy array
If the phase angle matrix is not provided, data will be a 2d numpy array containing the magnitude spectrogram. On the other hand, if the phase angle matrix is provided, data will be a 3d numpy array where data[:,:,0] contains the magnitude spectrogram and data[:,:,1] contains the complex phase angle.
- window_func: str
Window function.
Methods
empty()Creates an empty MagSpectrogram object
freq_res()Get frequency resolution in Hz.
from_wav(path, window, step[, channel, ...])Create magnitude spectrogram directly from wav file.
from_waveform(audio[, window, step, ...])Create a Magnitude Spectrogram from an
audio_signal.Waveformby computing the Short Time Fourier Transform (STFT).get_data()Get magnitude spectrogram data
Get keyword arguments required to create a copy of this instance.
Get magnitude spectrogram complex phase angle, if available
Get audio representation attributes
plot_phase_angle([figsize, cmap])Plot the complex phase matrix.
recover_waveform([num_iters, phase_angle, ...])Estimate audio signal from magnitude spectrogram.
- classmethod from_wav(path, window, step, channel=0, rate=None, window_func='hamming', offset=0, duration=None, resample_method='scipy', freq_min=None, freq_max=None, id=None, normalize_wav=False, transforms=None, waveform_transforms=None, compute_phase=False, decibel=True, smooth=0.01, **kwargs)[source]
Create magnitude spectrogram directly from wav file.
The arguments offset and duration can be used to select a portion of the wav file.
Note that values specified for the arguments window, step, offset, and duration may all be subject to slight adjustments to ensure that the selected portion corresponds to an integer number of window frames, and that the window and step sizes correspond to an integer number of samples.
- Args:
- path: str
Path to wav file
- window: float
Window size in seconds
- step: float
Step size in seconds
- channel: int
Channel to read from. Only relevant for stereo recordings
- rate: float
Desired sampling rate in Hz. If None, the original sampling rate will be used
- window_func: str
- Window function (optional). Select between
bartlett
blackman
hamming (default)
hanning
- offset: float
Start time of spectrogram in seconds, relative the start of the wav file.
- duration: float
Length of spectrogram in seconds.
- resample_method: str
- Resampling method. Only relevant if rate is specified. Options are
kaiser_best
kaiser_fast
scipy (default)
polyphase
See https://librosa.github.io/librosa/generated/librosa.core.resample.html for details on the individual methods.
- freq_min: float
Lower frequency in Hz.
- freq_max: str or float
Upper frequency in Hz.
- id: str
Unique identifier (optional). If None, the filename will be used.
- normalize_wav: bool
Normalize the waveform to have a mean of zero (mean=0) and a standard deviation of unity (std=1) before computing the spectrogram. Default is False.
- transforms: list(dict)
List of dictionaries, where each dictionary specifies the name of a transformation to be applied to the spectrogram. For example, {“name”:”normalize”, “mean”:0.5, “std”:1.0}
- waveform_transforms: list(dict)
List of dictionaries, where each dictionary specifies the name of a transformation to be applied to the waveform before generating the spectrogram. For example, {“name”:”add_gaussian_noise”, “sigma”:0.5}
- compute_phase: bool
Compute complex phase angle. Default it False
- decibel: bool
Convert to dB scale
- smooth: float
Width in seconds of the smoothing region used for stitching together audio files.
- **kwargs: additional keyword arguments
Keyword arguments to be passed to
ketos.audio.spectrogram.load_audio_for_spec()andketos.audio.waveform.from_waveform().
- Returns:
- : MagSpectrogram
Magnitude spectrogram
- Example:
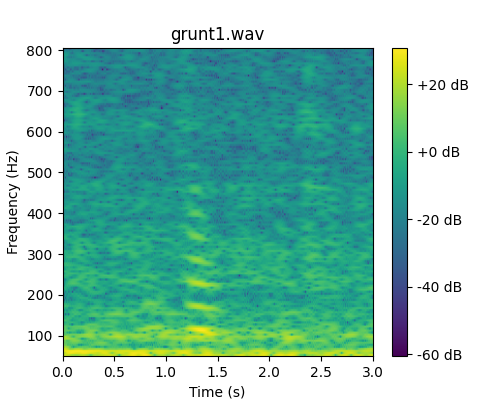
>>> # load spectrogram from wav file
>>> from ketos.audio.spectrogram import MagSpectrogram
>>> spec = MagSpectrogram.from_wav('ketos/tests/assets/grunt1.wav', window=0.2, step=0.01)
>>> # crop frequency
>>> spec = spec.crop(freq_min=50, freq_max=800)
>>> # show
>>> fig = spec.plot()
>>> fig.savefig("ketos/tests/assets/tmp/spec_grunt1.png")
>>> plt.close(fig)
- classmethod from_waveform(audio, window=None, step=None, seg_args=None, window_func='hamming', freq_min=None, freq_max=None, transforms=None, compute_phase=False, decibel=True, **kwargs)[source]
Create a Magnitude Spectrogram from an
audio_signal.Waveformby computing the Short Time Fourier Transform (STFT).- Args:
- audio: Waveform
Audio signal
- window: float
Window length in seconds
- step: float
Step size in seconds
- seg_args: dict
Input arguments used for evaluating
audio.audio.segment_args(). Optional. If specified, the arguments window and step are ignored.- window_func: str
- Window function (optional). Select between
bartlett
blackman
hamming (default)
hanning
- freq_min: float
Lower frequency in Hz.
- freq_max: str or float
Upper frequency in Hz.
- transforms: list(dict)
List of dictionaries, where each dictionary specifies the name of a transformation to be applied to the spectrogram. For example, {“name”:”normalize”, “mean”:0.5, “std”:1.0}
- compute_phase: bool
Compute complex phase angle. Default it False
- decibel: bool
Convert to dB scale
- Returns:
- spec: MagSpectrogram
Magnitude spectrogram
- get_kwargs()[source]
Get keyword arguments required to create a copy of this instance.
Does not include the data array and annotation handler.
- plot_phase_angle(figsize=(5, 4), cmap='viridis')[source]
Plot the complex phase matrix.
Returns None if the complex phase has not been computed.
Set compute_phase=True when you initialize the spectrogram to ensure that the phase is computed.
Note: The resulting figure can be shown (fig.show()) or saved (fig.savefig(file_name))
- Args:
- figsize: tuple
Figure size
- cmap: string
The colormap to be used. The colormaps available can be seen here: https://matplotlib.org/3.1.0/tutorials/colors/colormaps.html
- Returns:
- fig: matplotlib.figure.Figure
A figure object.
- recover_waveform(num_iters=25, phase_angle=None, subtract=0)[source]
Estimate audio signal from magnitude spectrogram.
Uses
audio.audio.spec2wave().- Args:
- num_iters:
Number of iterations to perform.
- phase_angle:
Initial condition for phase in radians. If not specified, the phase angle computed computed at initialization will be used, if available. If not available, the phase angle will default to zero and a warning will be printed.
- Returns:
- : Waveform
Audio signal