reduce_tonal_noise
- ketos.audio.utils.filter.reduce_tonal_noise(img, method='MEDIAN', **kwargs)[source]
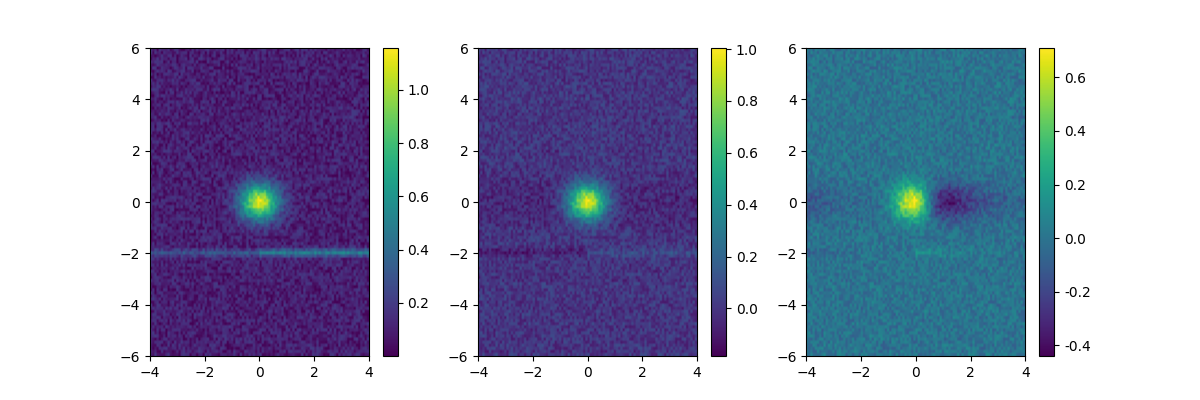
Reduce continuous tonal noise produced by e.g. ships and slowly varying background noise
Currently, offers the following two methods:
MEDIAN: Subtracts from each row the median value of that row.
RUNNING_MEAN: Subtracts from each row the running mean of that row.
The running mean is computed according to the formula given in Baumgartner & Mussoline, JASA 129, 2889 (2011); doi: 10.1121/1.3562166
- Args:
- img: numpy.array
Spectrogram image
- method: str
Options are ‘MEDIAN’ and ‘RUNNING_MEAN’
- Optional args:
- time_const_len: int
Time constant in number of samples, used for the computation of the running mean. Must be provided if the method ‘RUNNING_MEAN’ is chosen.
- Returns:
- img_new: numpy array
Corrected spectrogram image
- Example:
>>> import numpy as np
>>> from ketos.audio.utils.filter import reduce_tonal_noise, plot_image
>>> #create an image
>>> x = np.linspace(-4,4,100)
>>> y = np.linspace(-6,6,100)
>>> x,y = np.meshgrid(x,y,indexing='ij')
>>> img = np.exp(-(x**2+y**2)/(2*0.5**2)) #symmetrical Gaussian
>>> img += 0.2 * np.random.rand(100,100)  #add some flat noise
>>> #add tonal noise that exhibits sudden increase in amplitude
>>> img += 0.2 * (1 + np.heaviside(x,0.5)) * np.exp(-(y + 2.)**2/(2*0.1**2))
>>> #reduce tonal noise
>>> img_m = reduce_tonal_noise(img, method='MEDIAN')
>>> img_r = reduce_tonal_noise(img, method='RUNNING_MEAN', time_const_len=30)
>>> #draw the resulting images along with the original one
>>> import matplotlib.pyplot as plt
>>> fig, (ax1,ax2,ax3) = plt.subplots(1,3,figsize=(12,4)) #create canvas to draw on
>>> ext = (-4,4,-6,6)
>>> plot_image(img,fig,ax1,extent=ext)
>>> plot_image(img_m,fig,ax2,extent=ext)
>>> plot_image(img_r,fig,ax3,extent=ext)
>>> fig.savefig("ketos/tests/assets/tmp/image_tonal_noise_red1.png")