enhance_signal
- ketos.audio.utils.filter.enhance_signal(img, enhancement=1.0)[source]
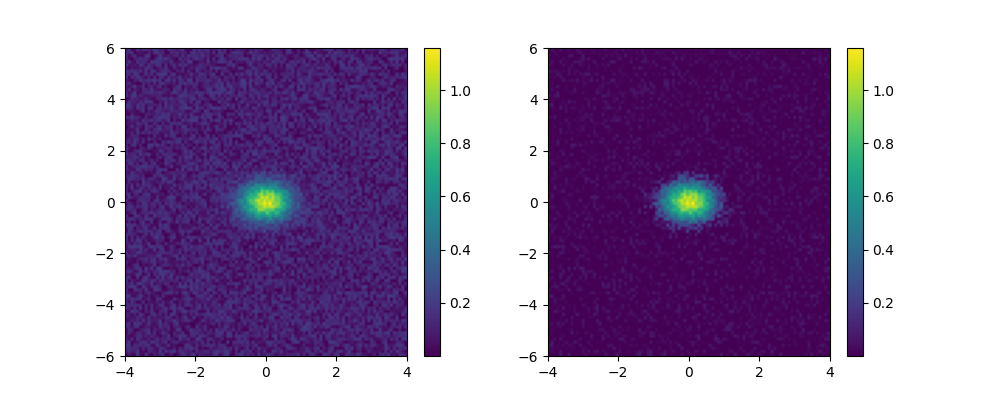
Enhance the contrast between regions of high and low intensity, while preserving the range of pixel values.
Multiplies each pixel value by the factor,
f(x) = ( e^{-(x - m_x - \sigma_m) / w} + 1)^{-1}
where x is the pixel value, m_x is the pixel value median of the image, and w = \sigma_x / \epsilon, where \sigma_x is the pixel value standard deviation of the image and \epsilon is the enhancement parameter.
Some observations:
f(x) is a smoothly increasing function from 0 to 1.
f(m_x)=0.5, i.e. the median m_x demarks the transition from “low intensity” to “high intensity”.
The smaller the width, w, the faster the transition from 0 to 1.
- Args:
- imgnumpy array
Image to be processed.
- enhancement: float
Parameter determining the amount of enhancement.
- Returns:
- img_en: numpy array
Enhanced image.
- Example:
>>> from ketos.audio.utils.filter import enhance_signal, plot_image
>>> #create an image
>>> x = np.linspace(-4,4,100)
>>> y = np.linspace(-6,6,100)
>>> x,y = np.meshgrid(x,y,indexing='ij')
>>> img = np.exp(-(x**2+y**2)/(2*0.5**2)) #symmetrical Gaussian
>>> img += 0.2 * np.random.rand(100,100)  #add some noise
>>> # apply enhancement
>>> img_enh = enhance_signal(img, enhancement=3.0)
>>> #draw the original image and its enhanced version
>>> import matplotlib.pyplot as plt
>>> fig, (ax1,ax2) = plt.subplots(1,2,figsize=(10,4)) #create canvas to draw on
>>> plot_image(img,fig,ax1,extent=(-4,4,-6,6))
>>> plot_image(img_enh,fig,ax2,extent=(-4,4,-6,6))
>>> fig.savefig("ketos/tests/assets/tmp/image_enhancement1.png")