GammatoneFilterBank
- class ketos.audio.gammatone.GammatoneFilterBank(data, rate, freqs, filename=None, offset=0, label=None, annot=None, weight_func=True, **kwargs)[source]
Gammatone filter bank.
The filtered signals are stored in a 2D numpy array, where the first axis (0) is the time dimension and the second axis (1) is the frequency dimension.
- Args:
- data: 2d numpy array
Filtered data
- rate: float
Sampling rate in Hz
- freqs: array-like
Center frequencies of the filter bank in Hz
- filename: str or list(str)
Name of the source audio file, if available.
- offset: float or array-like
Position in seconds of the left edge of the spectrogram within the source audio file, if available.
- label: int
Spectrogram label. Optional
- annot: AnnotationHandler
AnnotationHandler object. Optional
- weight_func: bool
Apply C weighting function. Default is True.
- Attributes:
- data: 2d numpy array
Filtered data
- rate: float
Sampling rate in Hz
- freqs: array-like
Center frequencies of the filter bank in Hz
- filename: str or list(str)
Name of the source audio file, if available.
- offset: float or array-like
Position in seconds of the left edge of the spectrogram within the source audio file, if available.
- label: int
Spectrogram label. Optional
- annot: AnnotationHandler
AnnotationHandler object. Optional
- weight_func: bool
Apply C weighting function.
Methods
empty()Creates an empty GammatoneFilterBank object
from_wav(path[, num_chan, freq_min, ...])Create a Gammatone Filter Bank directly from wav file.
from_waveform(audio[, num_chan, freq_min, ...])Create a Gammatone Filter Bank from an instance of
audio_signal.Waveform.Get audio representation attributes
plot(filter_id[, show_annot, figsize, ...])Plot the filtered signal with proper axes ranges and labels.
- classmethod from_wav(path, num_chan=20, freq_min=1, channel=0, rate=None, offset=0, duration=None, resample_method='scipy', id=None, normalize_wav=False, weight_func=True, **kwargs)[source]
Create a Gammatone Filter Bank directly from wav file.
The arguments offset and duration can be used to select a portion of the wav file.
Note that values specified for the arguments offset and duration may be subject to slight adjustments to ensure that the selected portion corresponds to an integer number of samples.
- Args:
- path: str
Path to wav file
- num_chan: int
Number of channels in the filter bank
- freq_min: float
Minimum frequency of the filter bank in Hz
- channel: int
Channel to read from. Only relevant for stereo recordings
- rate: float
Desired sampling rate in Hz. If None, the original sampling rate will be used
- offset: float
Start time of selection in seconds, relative the start of the wav file.
- duration: float
Length of selection in seconds.
- resample_method: str
- Resampling method. Only relevant if rate is specified. Options are
kaiser_best
kaiser_fast
scipy (default)
polyphase
See https://librosa.github.io/librosa/generated/librosa.core.resample.html for details on the individual methods.
- id: str
Unique identifier (optional). If None, the filename will be used.
- normalize_wav: bool
Normalize the waveform to have a mean of zero (mean=0) and a standard deviation of unity (std=1) before computing the spectrogram. Default is False.
- weight_func: bool
Apply C weighting function. Default is True.
- Returns:
- : GammatoneFilterBank
Gammatone filter bank
- Example:
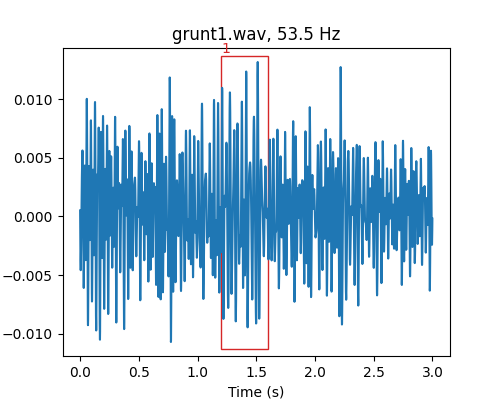
>>> # load gammatone filter bank from wav file
>>> from ketos.audio.gammatone import GammatoneFilterBank
>>> gfb = GammatoneFilterBank.from_wav('ketos/tests/assets/grunt1.wav', num_chan=20, freq_min=10, rate=1000)
>>> # print the center frequencies rounded to 1 decimal
>>> print(np.round(gfb.freqs,1))
[ 10.   23.7  38.2  53.5  69.7  86.8 104.9 124.1 144.3 165.7 188.4 212.3
 237.6 264.4 292.7 322.6 354.2 387.7 423.1 460.5]
>>> # display the 4th filter bank signal
>>> fig = gfb.plot(filter_id=3)
>>> fig.savefig("ketos/tests/assets/tmp/gfb3_grunt1.png")
>>> plt.close(fig)

- classmethod from_waveform(audio, num_chan=20, freq_min=1, weight_func=True)[source]
Create a Gammatone Filter Bank from an instance of
audio_signal.Waveform.- Args:
- audio: Waveform
Audio signal
- num_chan: int
Number of channels in the filter bank
- freq_min: float
Minimum frequency of the filter bank in Hz
- weight_func: bool
Apply C weighting function. Default is True.
- Returns:
- gfb: GammatoneFilterBank
Gammatone filter bank
- plot(filter_id, show_annot=False, figsize=(5, 4), label_in_title=True, show_envelope=False)[source]
Plot the filtered signal with proper axes ranges and labels.
Optionally, also display annotations as boxes superimposed on the signal.
Note: The resulting figure can be shown (fig.show()) or saved (fig.savefig(file_name))
- Args:
- filter_id: int
Filter to be plotted.
- show_annot: bool
Display annotations
- figsize: tuple
Figure size
- label_in_title: bool
Include label (if available) in figure title
- show_envelope: bool
Display envelope on top of signal
- Returns:
- : matplotlib.figure.Figure
A figure object.
- Example:
>>> from ketos.audio.gammatone import GammatoneFilterBank
>>> # load gammatone filter bank
>>> gfb = GammatoneFilterBank.from_wav('ketos/tests/assets/grunt1.wav', num_chan=20, freq_min=10, rate=1000)
>>> # add an annotation
>>> gfb.annotate(start=1.2, end=1.6, freq_min=70, freq_max=600, label=1)
>>> # show the 4th filter bank with annotation box
>>> fig = gfb.plot(filter_id=3, show_annot=True)
>>> fig.savefig("ketos/tests/assets/tmp/gfb3_w_annot_box.png")
>>> plt.close(fig)