For Users
This part lists all the steps required to run the Kedgi application.
Step 1 - Input
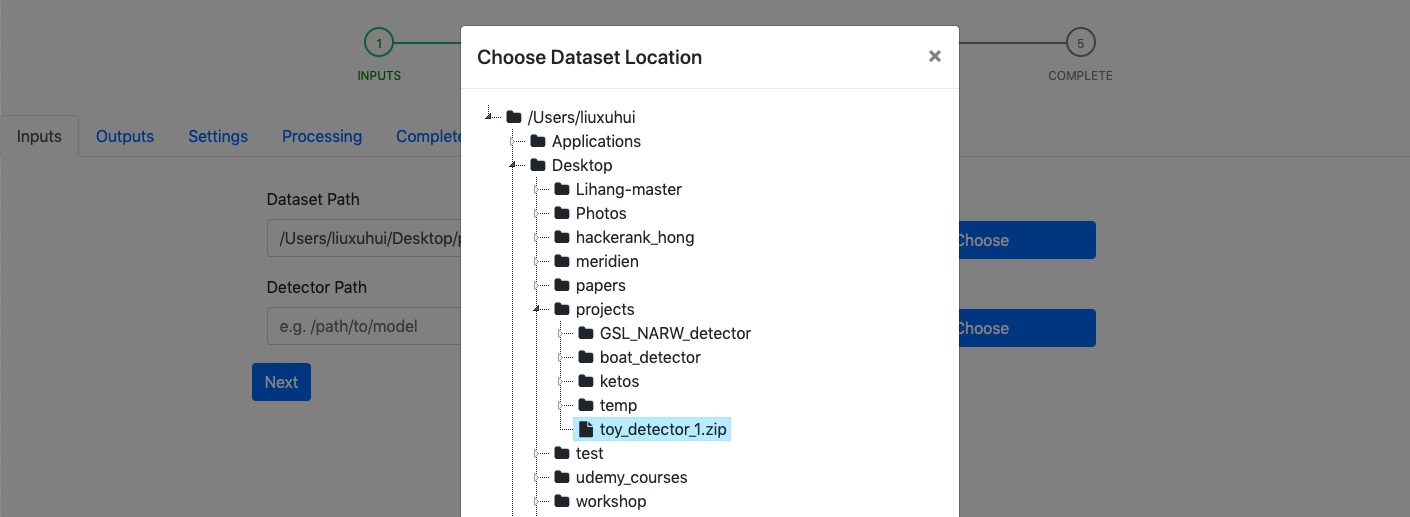
Input page requires users’ inputs of the path to data set and the path to archived detector file. Users can either manually enter or select those paths (by clicking Choose button). In the popup window where shows the representation of the file system, only folders and files with .tar,.zip, .gz extensions are presented.
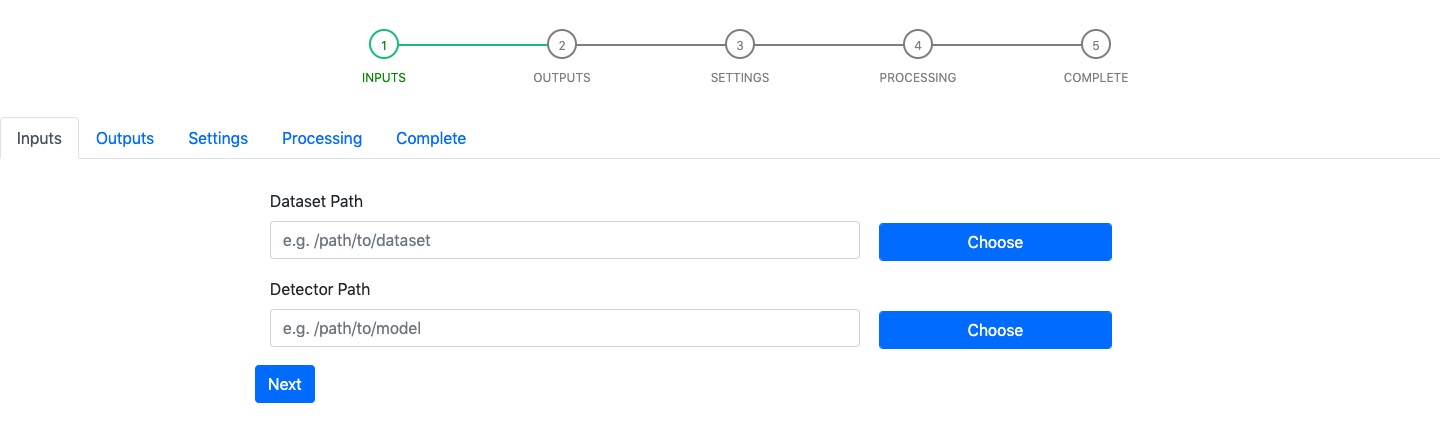
Example: Choosing the detector file using file prompt (see figure below).
After filling these inputs, you can move to the next step by clicking the Next button (Errors will be displayed if the given paths are incorrect).
Step 2 - Output
Output page requires users to enter the path to the output folder, which will contain unzipped detector files (unzip operation is taken by Kedgi privately) and classification outputs in the future.
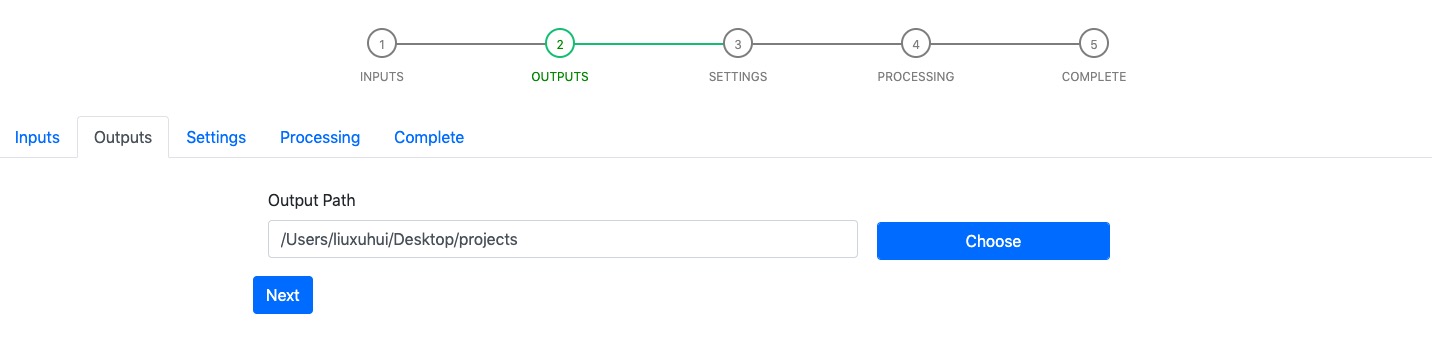
Similarly, you can use the Choose button to select the output folder of interest.
After filling the output path, you then can move on to the next step by clicking the Next button.
Step 3 - Settings
Settings page gives users the option to update the default paramaters, including the CLI arguments and extra parameters used by the classifier/detector. We save modified values in a settings.json file within the project rather than override default values in the unzipped detector’s folder. This can prevent users from losing paramount parameters values that have been tested and shown best performance on their datasets.
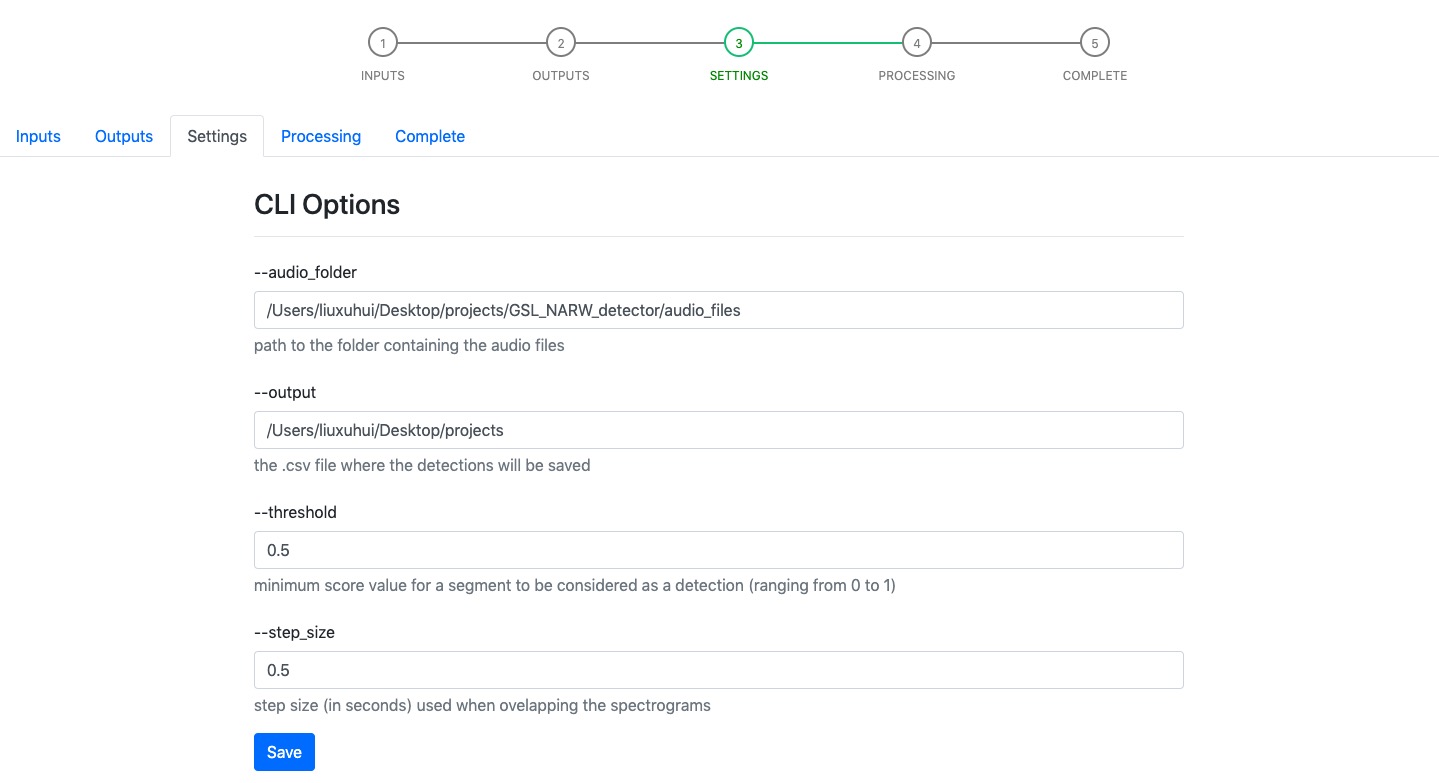
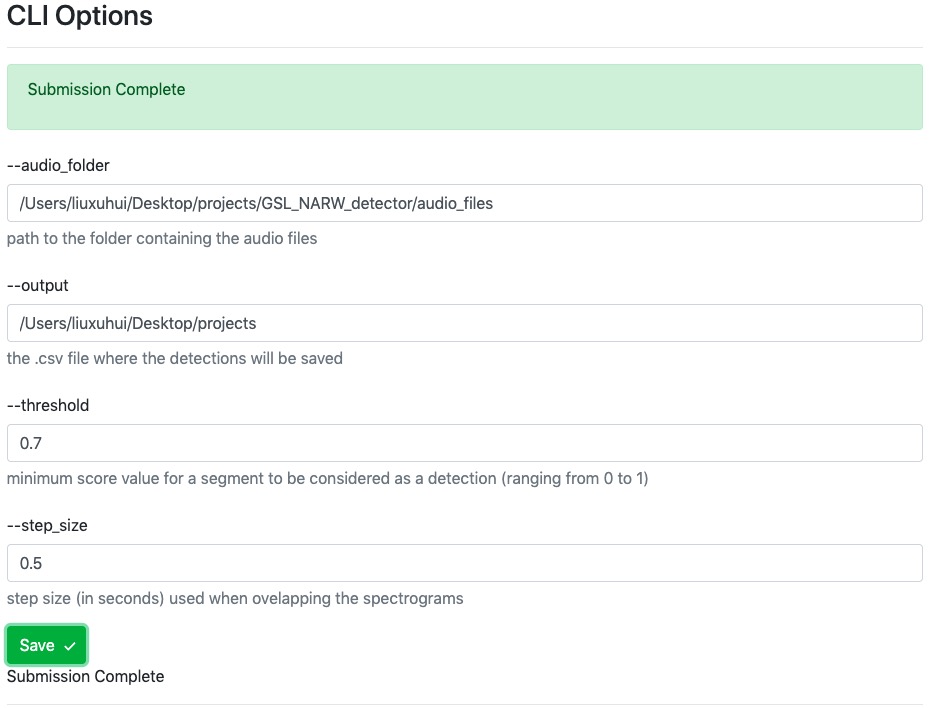
Example: if you want to make a change to the default parameters, please click Save button and we will synchronize changed parameters with the background copies of these files.
Please Note: the --output parameter requires filename with .csv extension.
After making sure all the parameters are updated correctly, you can then proceed to next step by clicking the Next button.
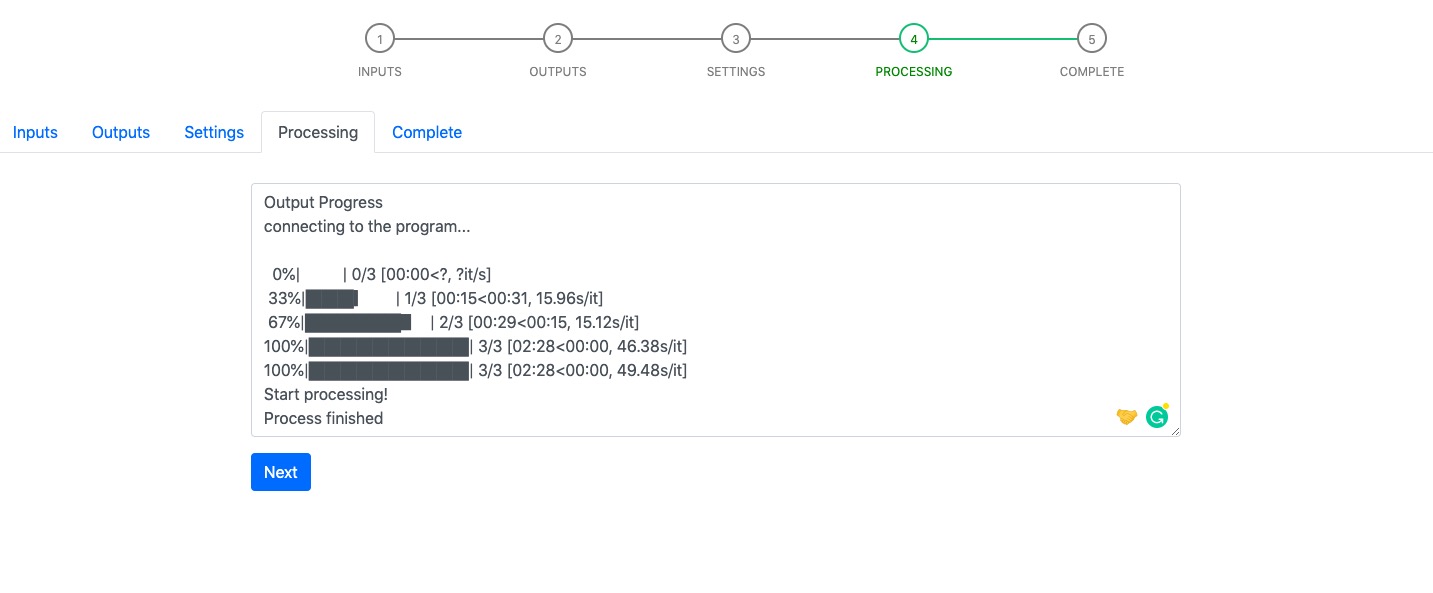
Step 4 - Processing
Processing page displays a textfield. It shows the run-time messages from detector/classifier. The Next button will be restored after the detection program finishes.
Step 5 - Complete
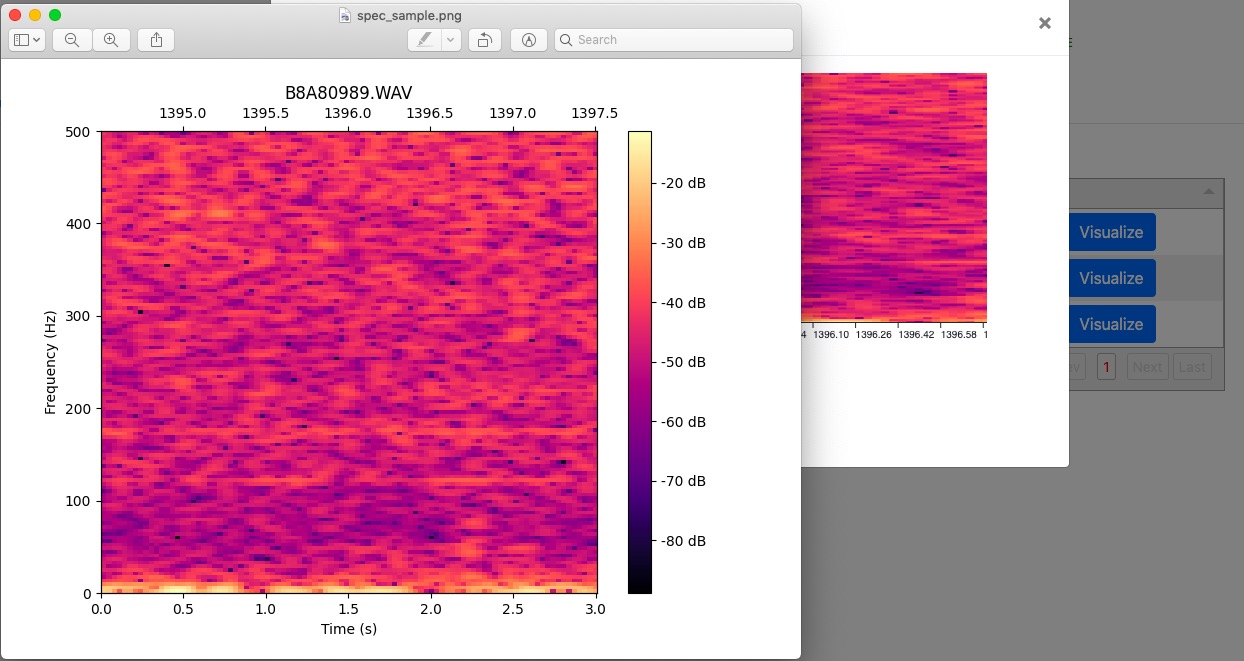
Complete page shows the customized spectrogram configuration parameters (hidden by default), and detections/classification results (in the table). Users are given the option to visualize the classified results by clicking the “Visualize” button. Users can make change to the spectrogram configuration parameters and the changed parameters are used to compute the new spectrogram visualization.
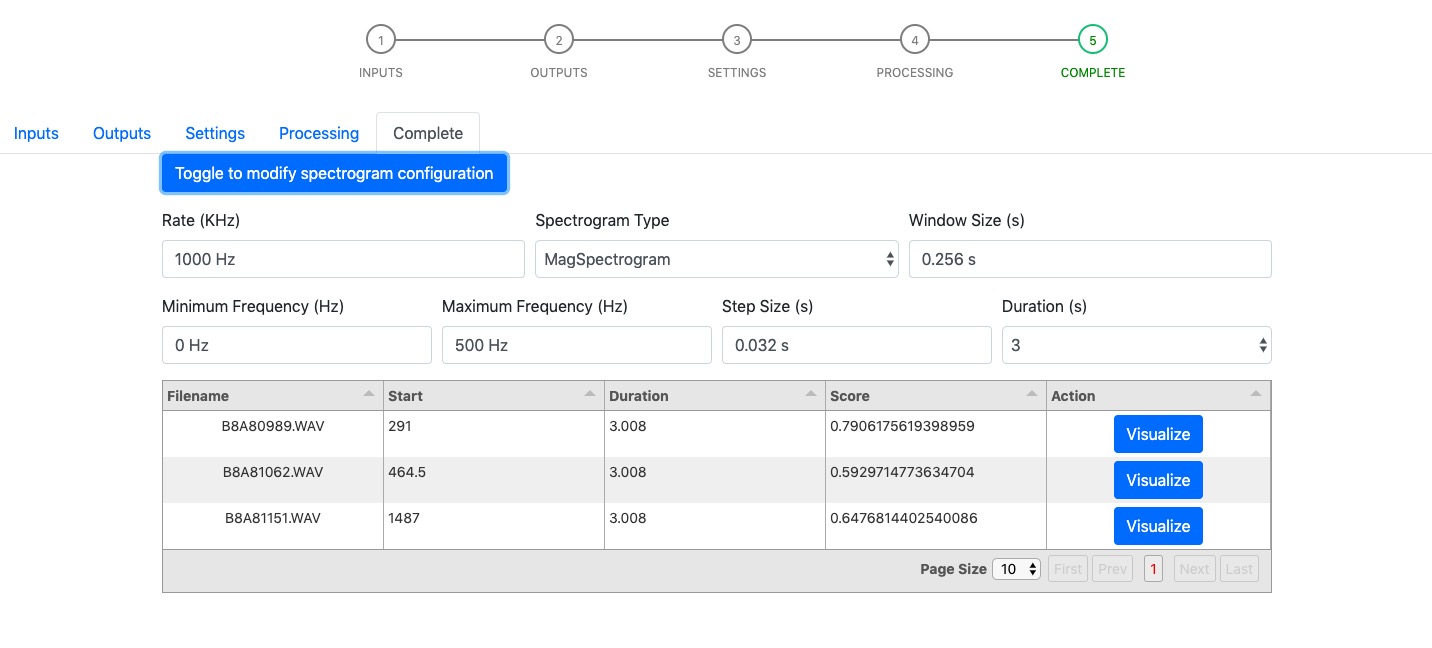
The “Visualize” button invokes a modal containing the spectrogram and a “Save” button. It provides user with the option to save spectrogram of their interest.
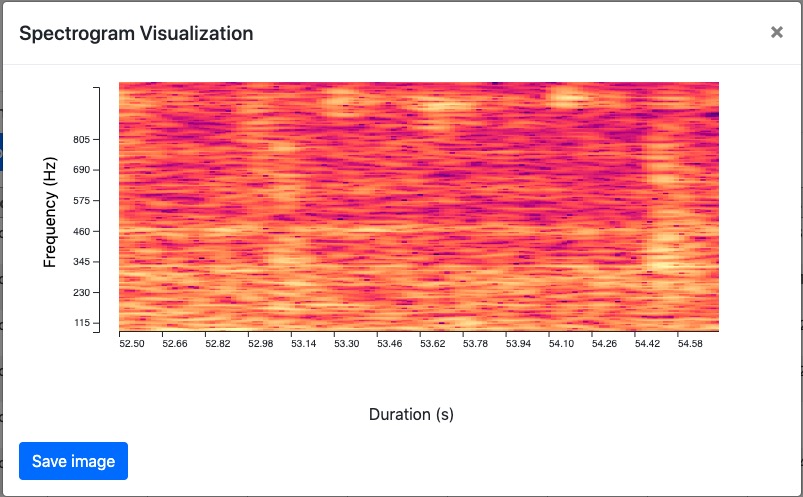
The “Save” button will prompt a file window that allows user to choose the place to save the spectrogram.